Random Walk Simulation
Personal Project — Stochastic Simulation & Interactive Visualization
Overview
This project is an interactive random walk simulator built with Python, Dash, and Plotly. Each simulation generates a new 1,000-step random walk path at the click of a button, visualizing stochastic movement through a 2D plane. The tool demonstrates core concepts in probability and simulation while delivering a polished, interactive user experience.
The Problem
Random walks are a fundamental concept in probability theory, physics, and financial modeling, yet they can be difficult to intuit without visual feedback. Static plots fail to communicate the generative, unpredictable nature of stochastic processes. The goal was to create a dynamic tool that makes this behavior immediately tangible and explorable.
Solution & Contributions
- Built a Dash web application with a "Generate Values" button that triggers a fresh 1,000-step random walk simulation on each click.
- Used NumPy to efficiently compute cumulative step positions from randomly sampled unit vectors.
- Rendered the walk as an interactive Plotly line chart with hover tooltips showing step index and position coordinates.
- Designed a clean, responsive layout suitable for both desktop and browser-based demos.
Technical Approach
At each step, a random direction is sampled and accumulated to produce the walk trajectory. Dash callbacks bind the button interaction to Python-side computation, passing the resulting data to a Plotly figure rendered client-side. This architecture keeps the simulation logic cleanly server-side while delivering a responsive, interactive frontend.
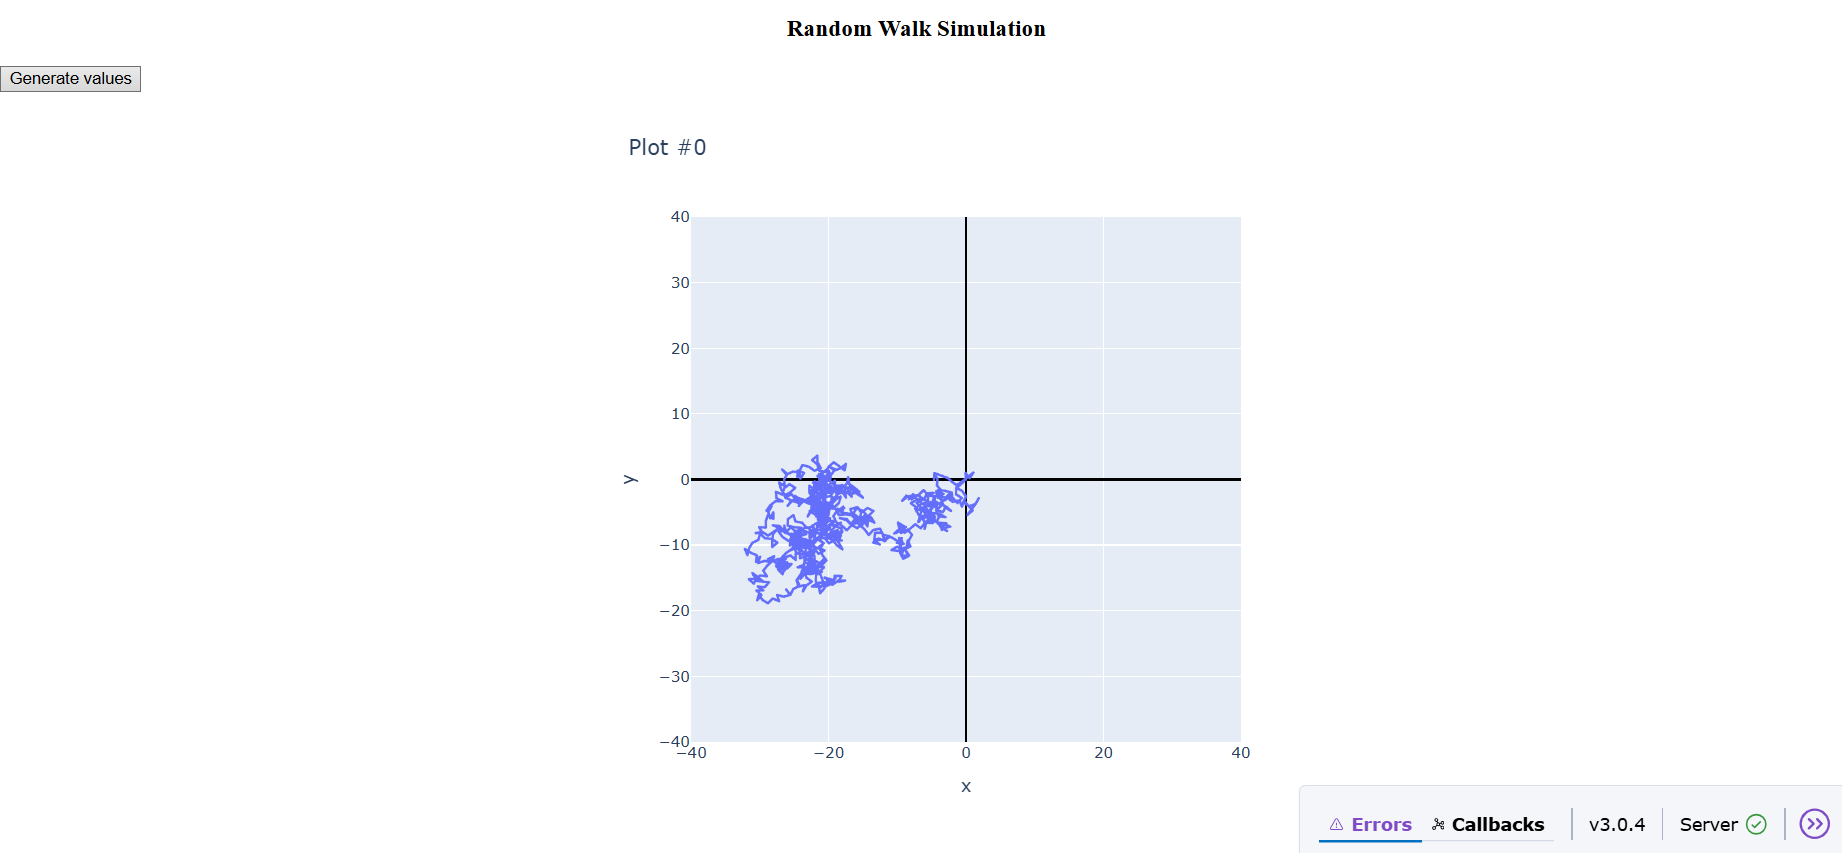
Sample Output